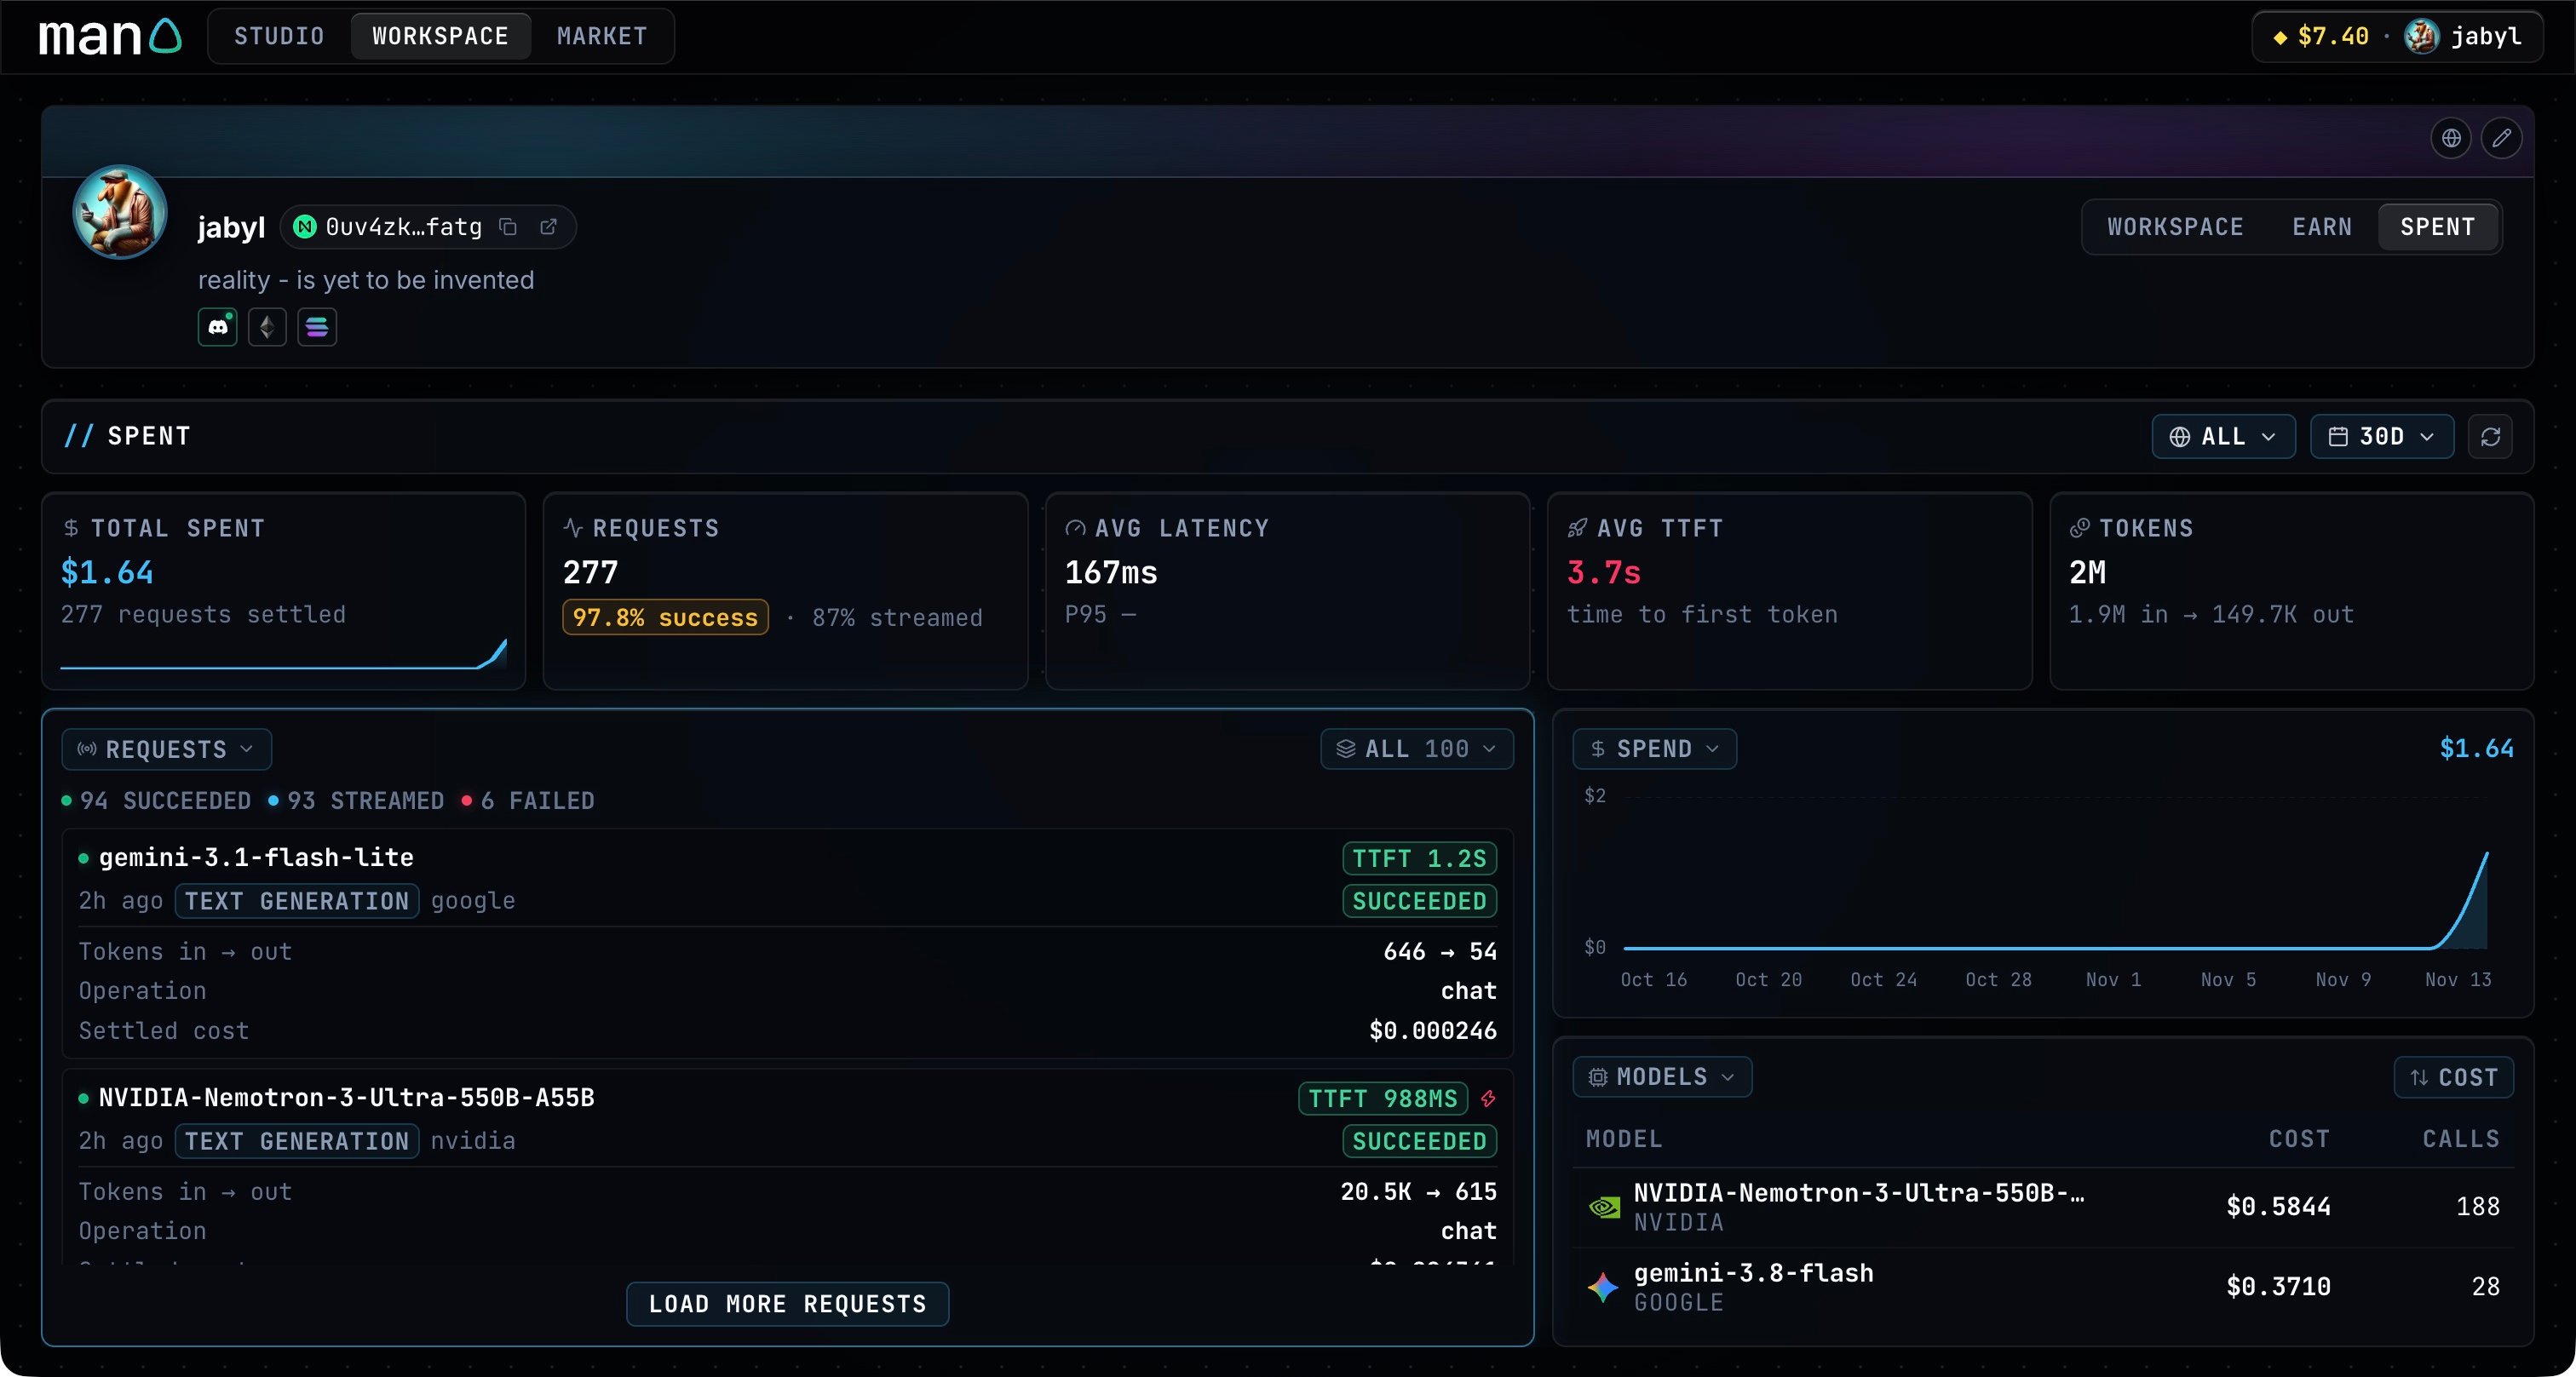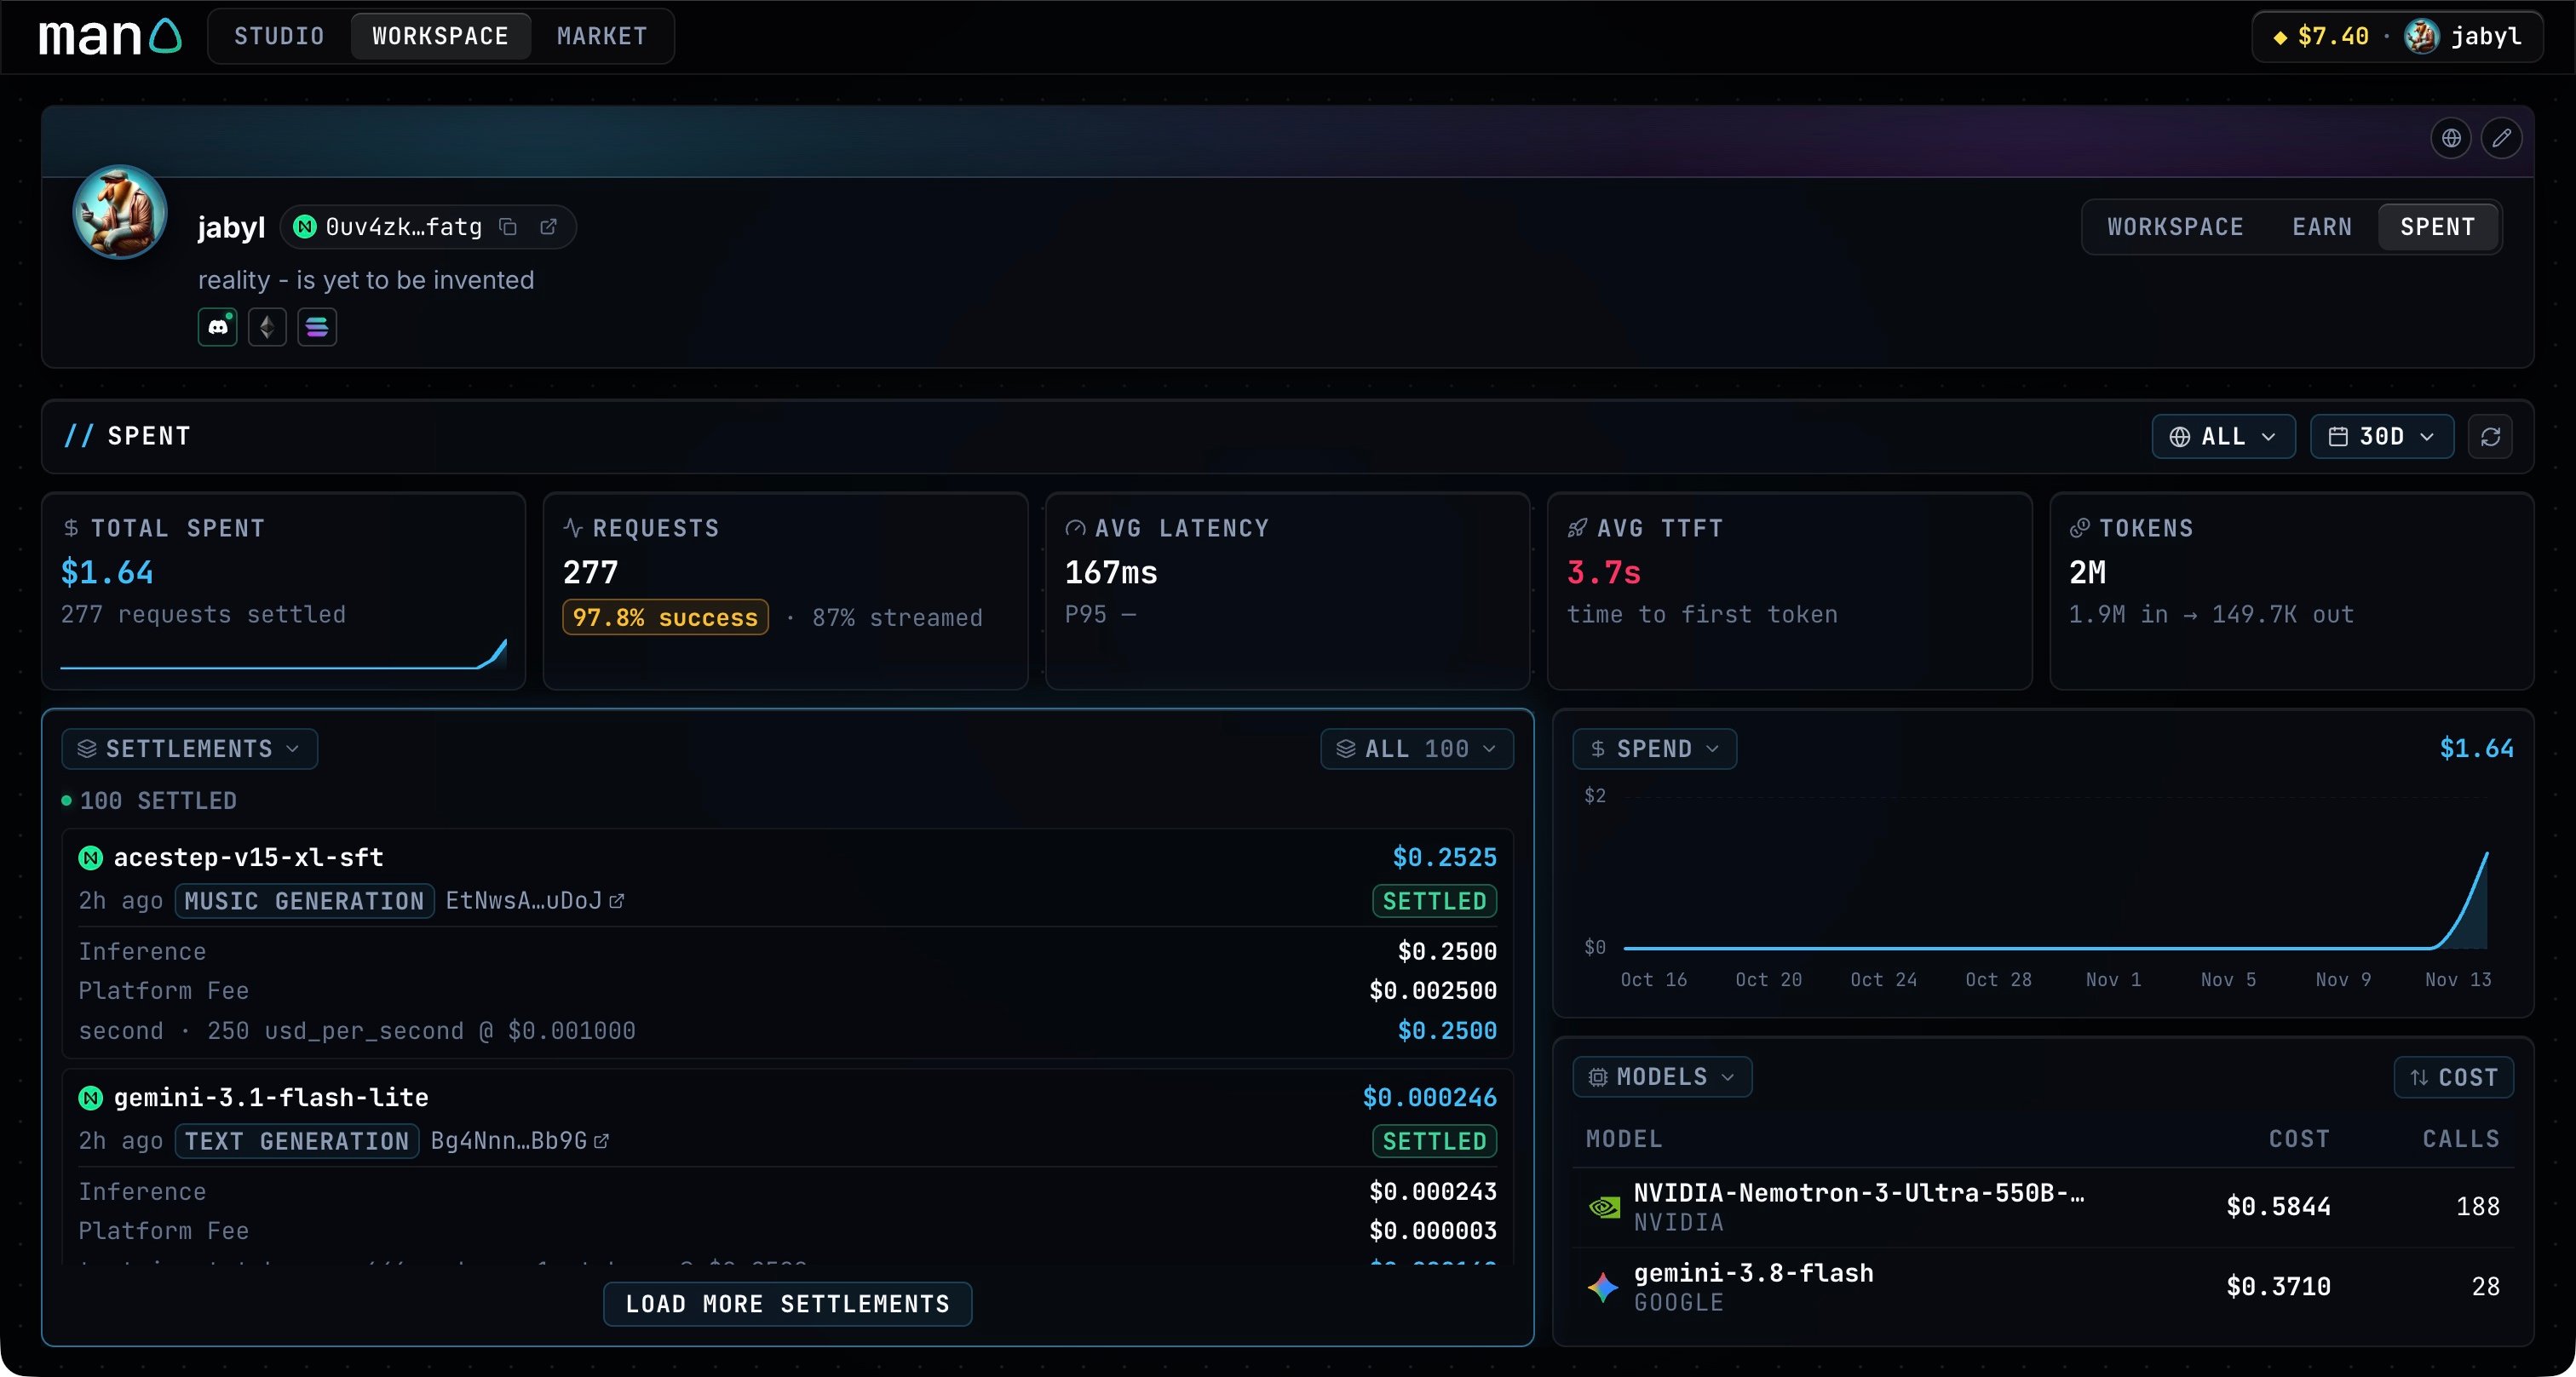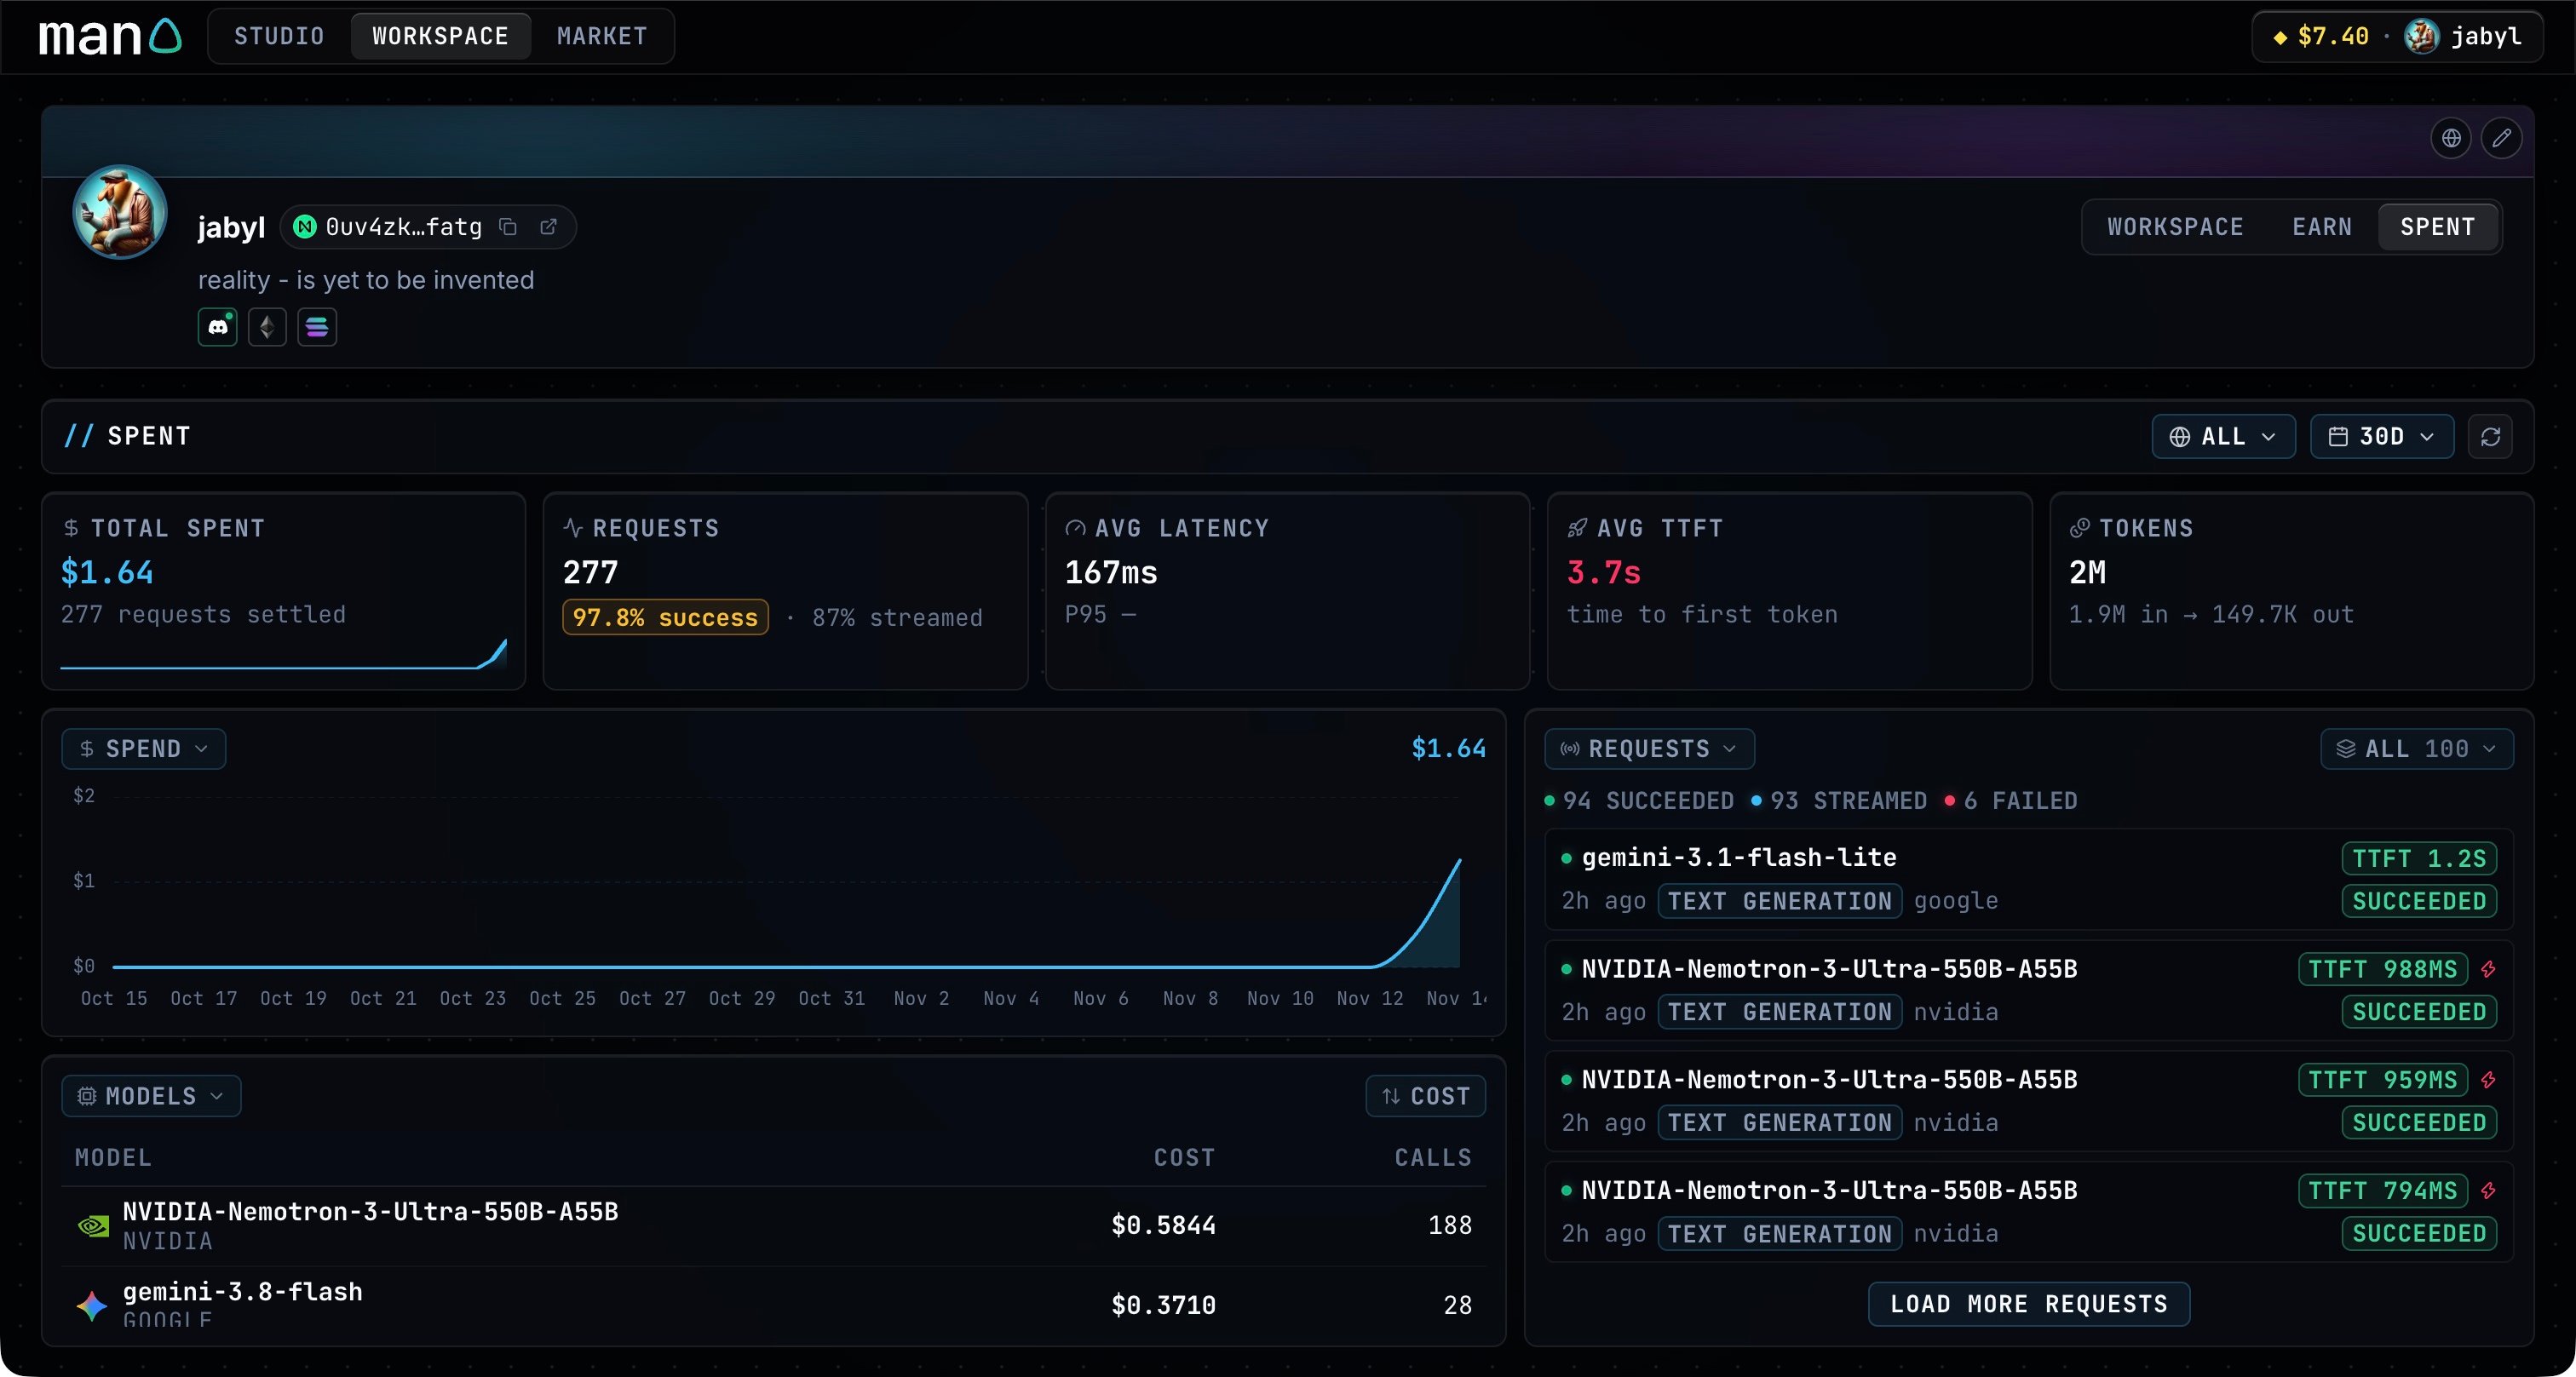
Compare cost and performance
Total Spent shows settled spending. Requests includes the success rate and share of streamed responses; Avg Latency measures the full request, while Avg TTFT measures time to the first token. Tokens separates input and output. Click the chart to expand it, then choose SPEND, REQUESTS, TOKENS or LATENCY. Hover over a point to read its values; the latency chart compares average, P50, P95 and P99 timings.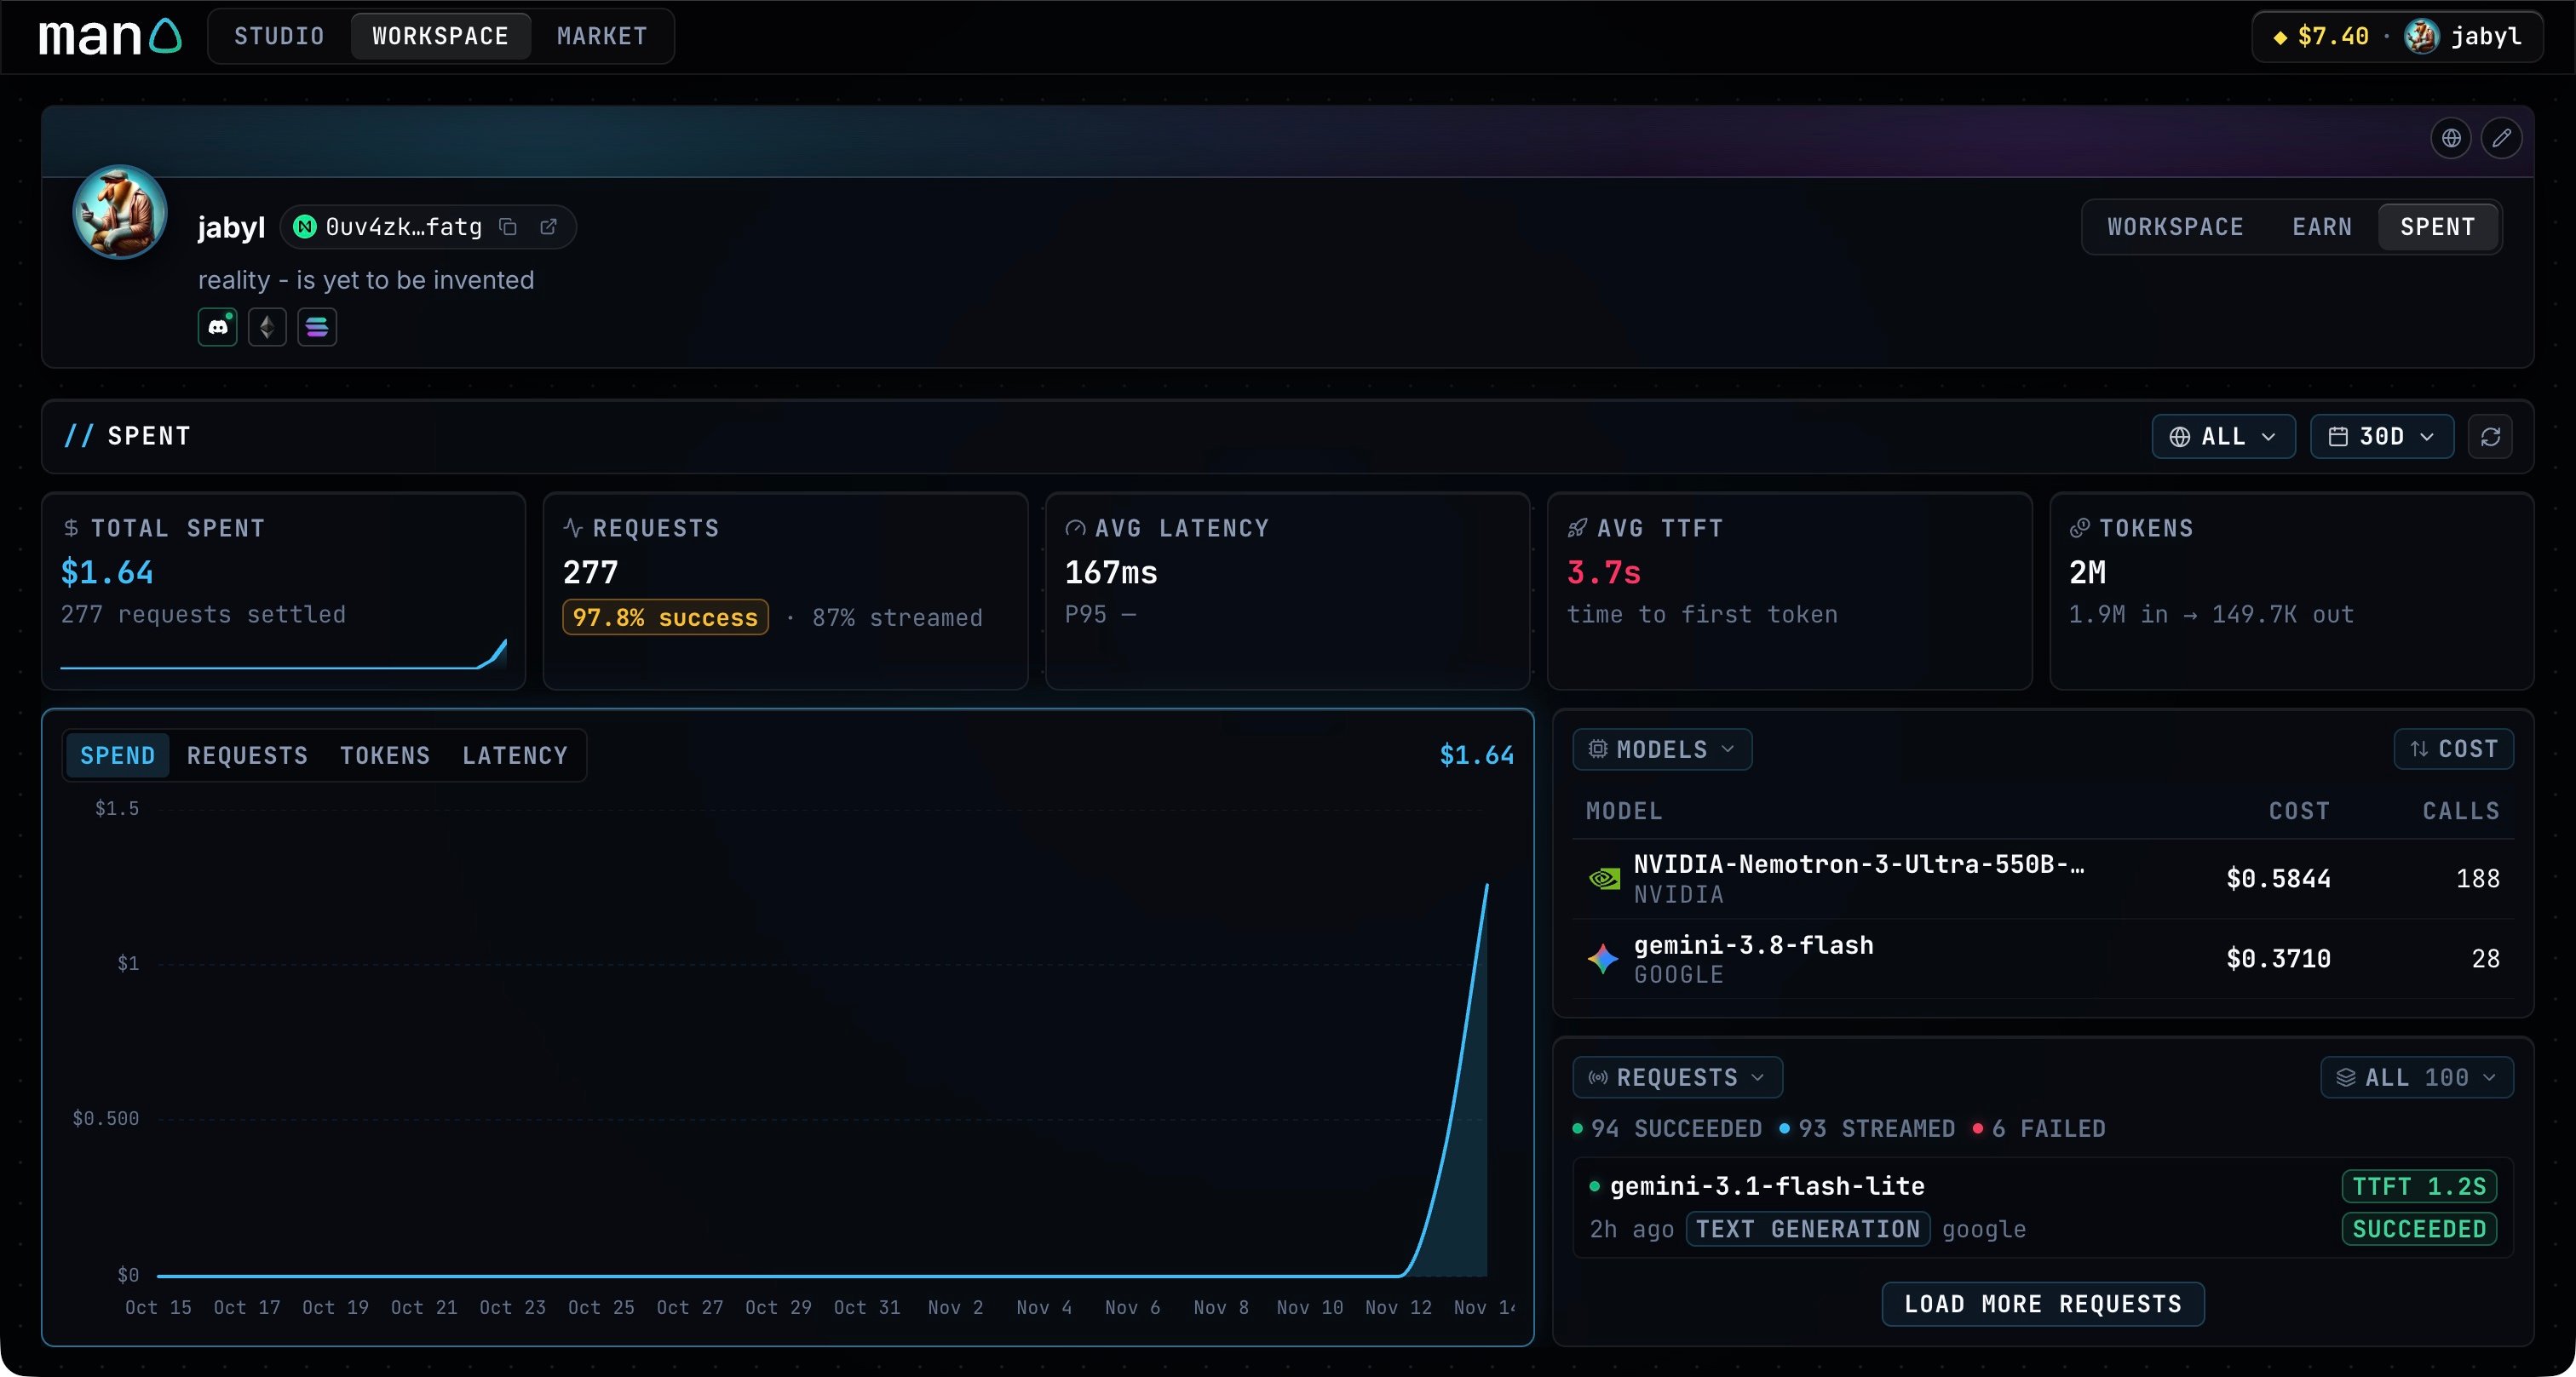
Find the models behind the bill
Click the model table to expand it. Search by model or provider, and sort by COST, CALLS, TOKENS, LATENCY, SUCCESS, RECENT or TYPE. The P95 column is the time within which 95% of requests finished.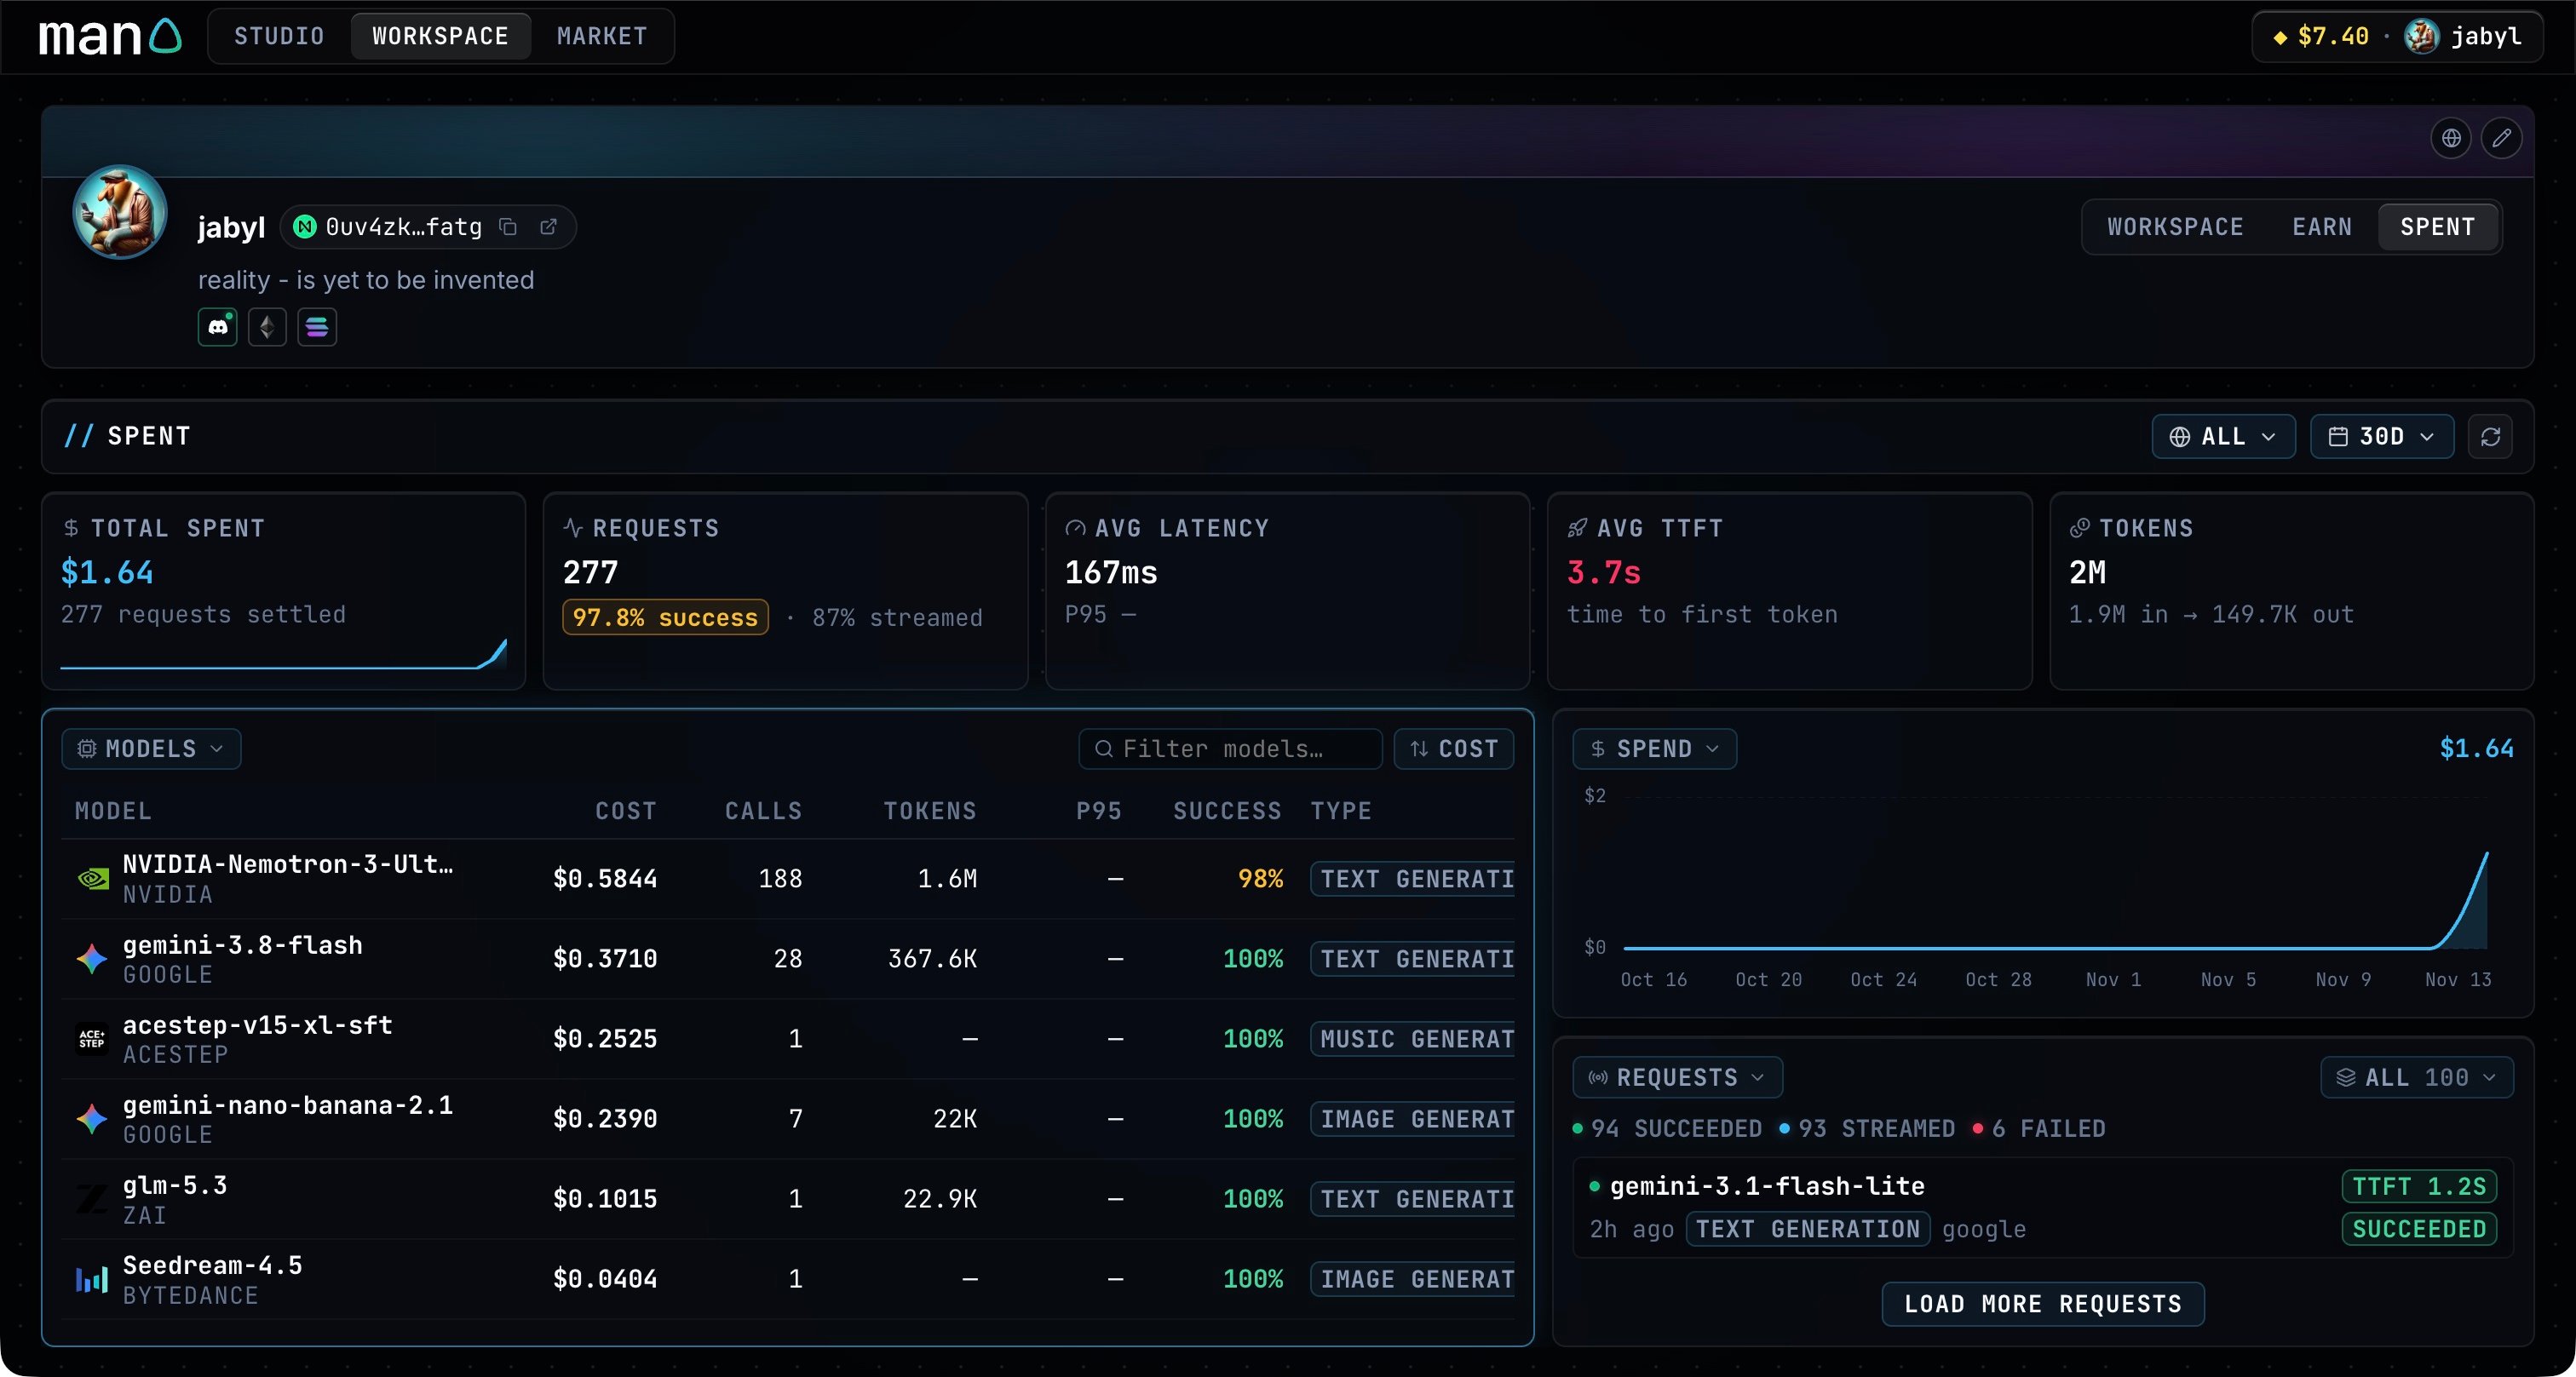
Inspect requests and settlements
Expand the activity panel. REQUESTS shows individual calls and their status, timing, token counts, operation and settled cost. Use the status filter to narrow the list.- Requests
- Settlements